What's happening in your pump room is costing you more than you think.
Did you know?
25–40% of a property's utility bill comes from pump and circulation systems alone.
Energy is one of the largest operating costs in a pool facility — and one of the least understood. Without the right visibility, equipment runs inefficiently, costs climb, and savings get left on the table.
VivoPoint Energy Monitoring changes that. Connect it to your existing systems and immediately start tracking kWh usage, cost savings, amp draw, VFD status, and equipment health — all in one place.
For facilities that want to go further, our team installs and optimizes VFDs as part of a complete energy solution — giving you the equipment, the optimization, and the historical data to show exactly how much you've saved.
Key Capabilities
Everything your team needs
to manage energy costs.
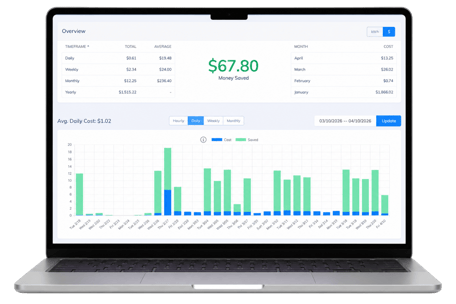
VivoPoint's Energy Monitoring dashboard gives you the data to reduce waste, quantify savings, and report with confidence — without leaving the platform you already use.
⚡
Real-Time Energy Visibility
Monitor live kWh usage from every connected device in your pump room. Track amps, flow rate, turnover, speed percent, and VFD status — all updated continuously.
⚡
Quantify VFD Savings
See exactly how much energy and money your variable frequency drives are saving. Dedicated savings calculations displayed in both kWh and dollars — front and center.
⚡
Cost Tracking Built In
Enter your property's energy rate and instantly see estimated costs broken down daily, weekly, monthly, and yearly. Toggle between kWh and dollar views at any time.
⚡
Multi-Device Support
Track multiple VFDs, pumps, and energy sensors per system. View individual device readings or summarized totals across all equipment from a single overview table.
⚡
Sustainability Reporting
Energy consumption integrates into VivoPoint Analytics alongside water data. Portfolio managers and sustainability officers can export reports and track utility costs over time.
⚡
Historical Trend Analysis
Visualize energy usage over time with bar charts showing daily, weekly, or monthly trends. Compare consumption vs. savings side by side to demonstrate clear ROI.
Built for Every Stakeholder
One platform. Every role.
Facility Managers & Pool Operators
Monitor daily pump room energy usage and costs at your property. Catch inefficiencies early and keep equipment running at optimal performance.
Regional Directors & Portfolio Managers
Compare energy efficiency and cost across multiple properties from a single view. Identify high-performing sites and replicate best practices portfolio-wide.
Sustainability & Energy Managers
Track organization-wide energy consumption, export data for external reporting, and clearly demonstrate the ROI of your energy-efficiency investments.
"We finally have one view across every property and the data to back up every efficiency conversation."
— Operations team, multi-property resort group
What You Can Track
Nine metrics. One dashboard.
kWh Consumption
Current and historical energy usage
Energy Cost ($)
Estimated costs based on your utility rate
Energy Savings (kWh)
Savings calculated from VFD operation
Cost Savings ($)
Dollar value of energy saved
Current (Amps)
Live amperage from VFDs and sensors
Speed Percent (%)
VFD motor speed percentage
Flow Rate (GPM)
Water flow through the system
Turnover
System turnover rate
VFD Status
Operating mode and health status
Analytics & Reporting Integration
Energy consumption data lives in VivoPoint Analytics right alongside your water consumption metrics. Portfolio managers and sustainability officers can view energy data across multiple properties, export reports, and track utility costs over time.
Making it easy to demonstrate ROI
One platform for water & energy
No new logins. No new dashboards to learn. Energy Monitoring is built directly into the VivoPoint platform your team already uses for water safety and monitoring.
Already Have VFDs?
Connect them in minutes.
If your property already has variable frequency drives installed, our team can connect them to VivoPoint and turn on Energy Monitoring on your existing account.
Not sure where to start? Our team will spec, install, and optimize the right VFDs for your property — then power the dashboard with the data they generate.